Student Pandas Training for Data Analysis
Master data manipulation and analysis with Python's most powerful library. Specially designed course for students aspiring to become data analysts and data scientists.
Become a Data Analysis Expert with Pandas
Pandas is the most popular data manipulation and analysis library for Python. It provides fast, flexible, and expressive data structures designed to make working with structured data easy and intuitive. At OrcaMinds, our student Pandas training program is specially designed for college students and data science aspirants to master data analysis skills.
We offer classroom-based training for students with small batch sizes, hands-on projects, and real-world datasets. Whether you are pursuing BCA, BSc, BE, BTech, or any data science course, our Pandas training will help you excel in academics and build a strong foundation for your data science career.
Why Should Students Learn Pandas?
High Demand Skill
Essential for data science jobs
Career Growth
Data Analyst, Data Scientist roles
Real Projects
Work with real-world datasets
Course Curriculum for Students
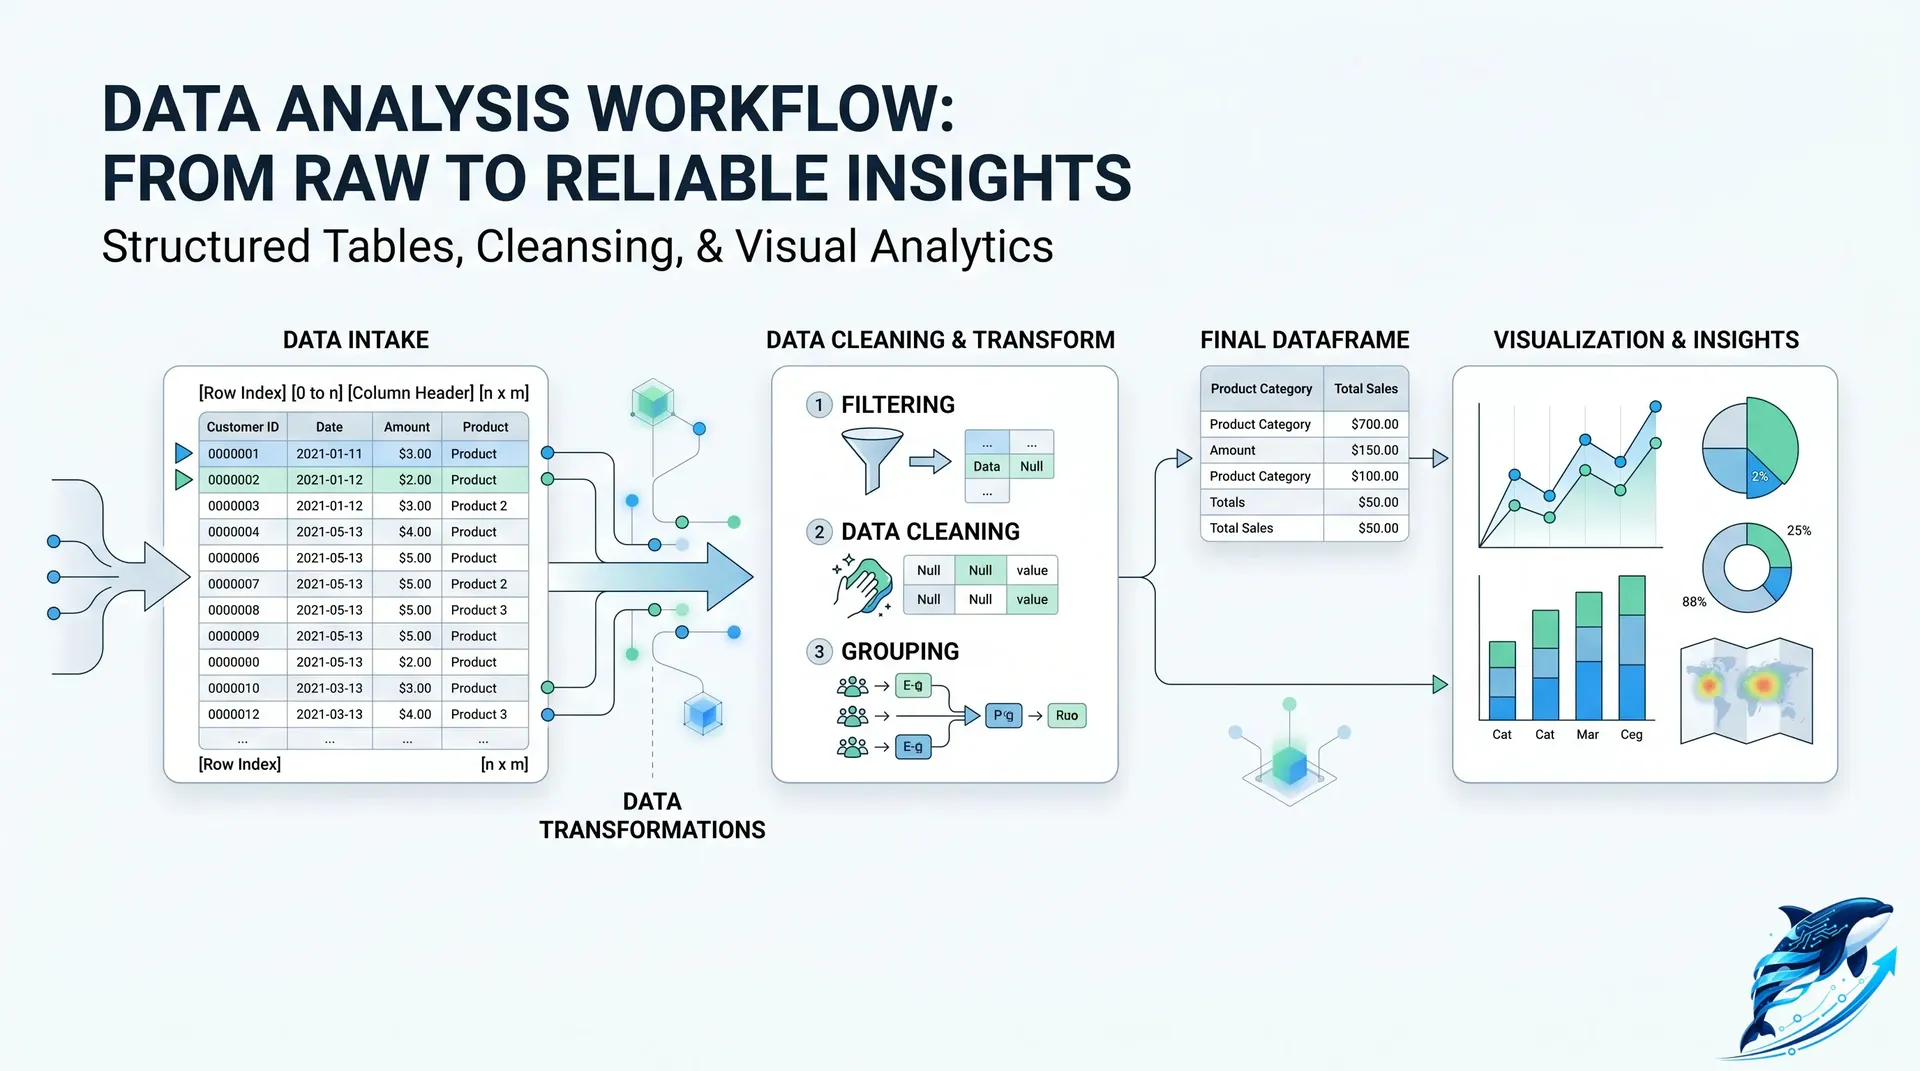
Module 1: Introduction to Pandas
What is Pandas? Installing Pandas, Series (1D labeled array), DataFrame (2D labeled data structure), reading data from CSV/Excel/JSON.
Module 2: Data Inspection & Exploration
Viewing data (head, tail, sample), info(), describe(), shape, dtypes, understanding data structure and statistics.
Module 3: Data Selection & Filtering
Selecting columns, filtering rows with conditions, loc[] and iloc[], boolean indexing, query() method.
Module 4: Data Cleaning
Handling missing values (isnull, dropna, fillna), removing duplicates, handling outliers, data type conversion.
Module 5: Data Transformation
Creating new columns, apply() and map() functions, lambda functions, string operations, datetime handling.
Module 6: Grouping & Aggregation
groupby() operations, aggregate functions (sum, mean, count, min, max), pivot tables, crosstab.
Module 7: Merging & Joining
concat(), merge(), join() - combining multiple DataFrames, handling different join types (inner, outer, left, right).
Module 8: Data Visualization with Pandas
Basic plotting with Pandas (line, bar, histogram, scatter, box plots), integration with Matplotlib and Seaborn.
Student-Friendly Features
Small Batch Size
Max 15 students per batch
Real Datasets
Work with real-world data
Flexible Schedule
Weekend & weekday batches
Industry Projects
Build portfolio of projects
Certificate
Course completion certificate
Placement Support
Job assistance after course
Projects Students Will Build
Sales Data Analysis
Analyze sales trends, top products, seasonal patterns
Customer Segmentation
Group customers based on purchasing behavior
Employee Attrition Analysis
Analyze factors affecting employee turnover
Financial Data Analysis
Stock price analysis, returns calculation, trends
How Students Learn
Learn Concepts
Interactive classroom sessions explaining Pandas concepts with examples.
Practice Coding
Hands-on coding exercises and assignments after each session.
Build Projects
Apply concepts to build real data analysis projects.
Assessment & Certification
Final test, project submission, and course completion certificate.