Pandas Training for Data Analysis
Master data manipulation and analysis with Python's most powerful library. Learn to clean, transform, analyze, and visualize data like a pro.
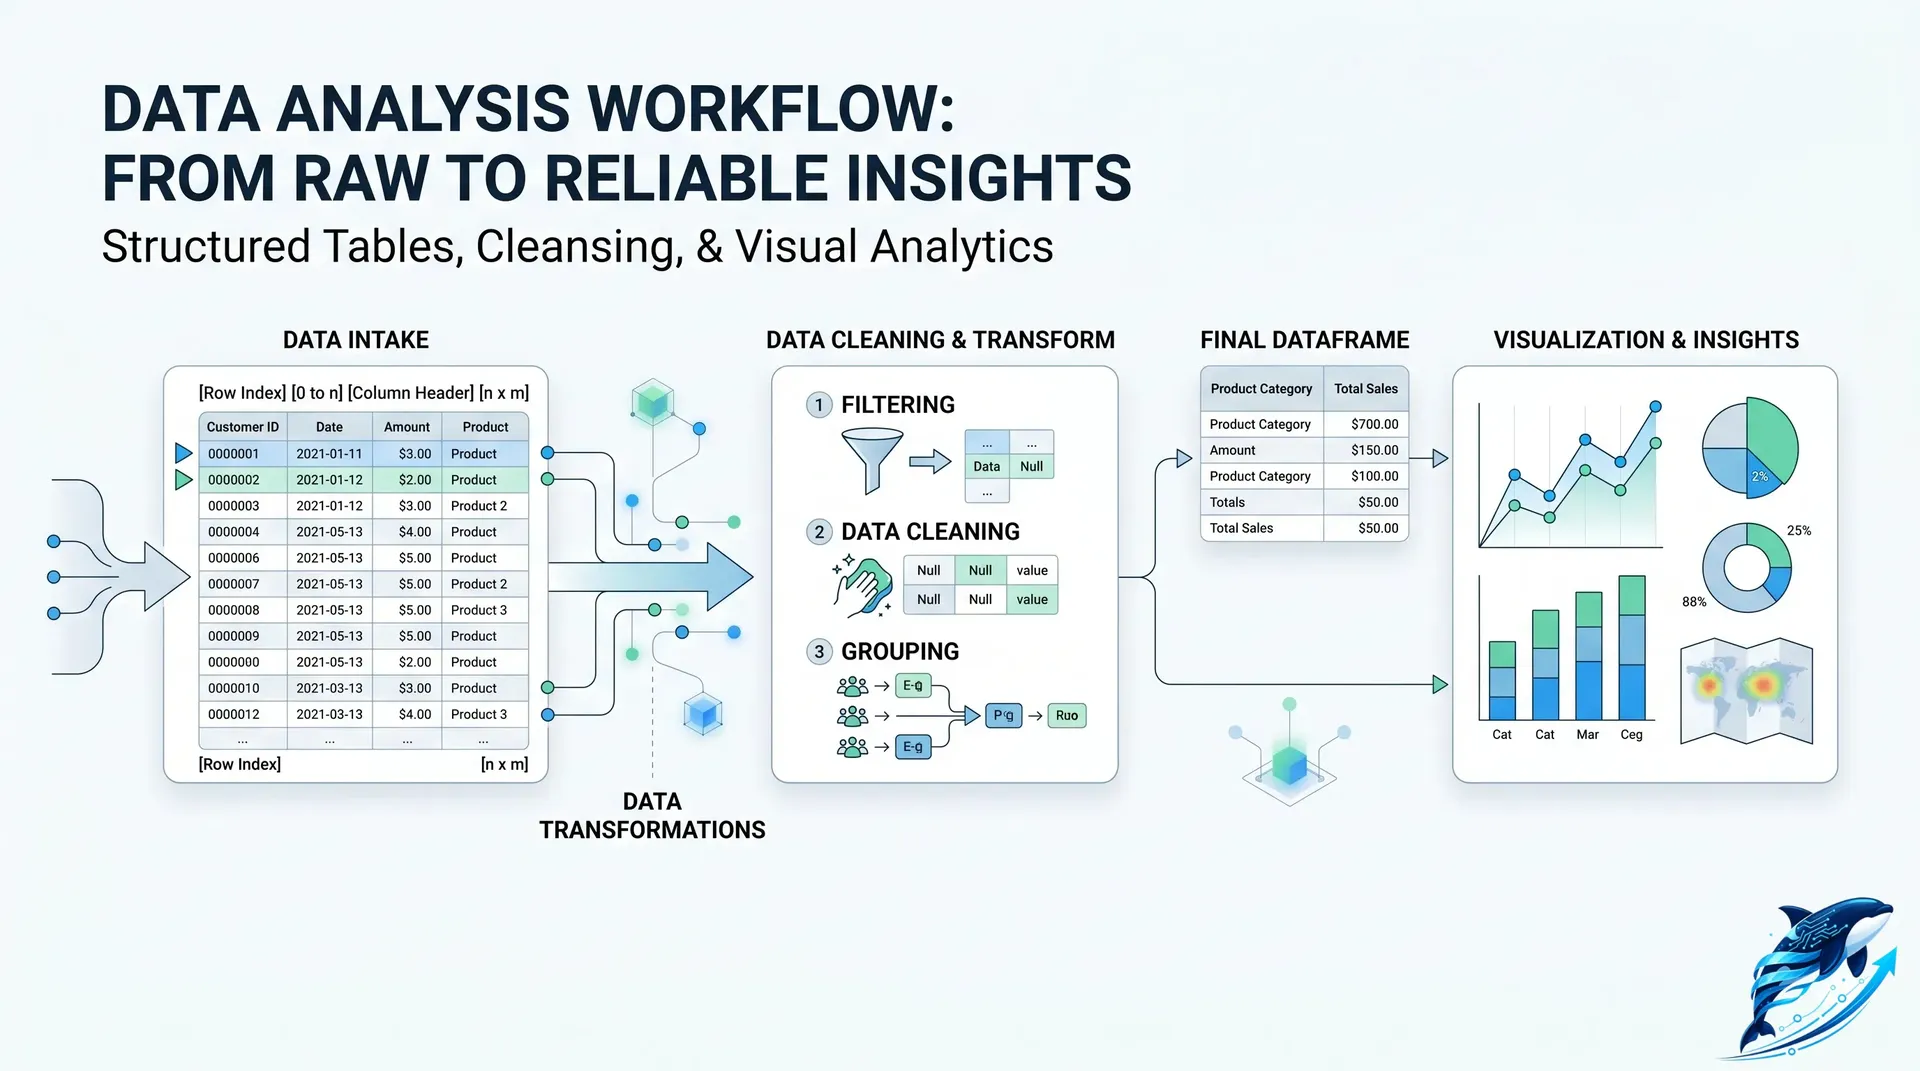
Become a Data Analysis Expert with Pandas
Pandas is the most popular data manipulation and analysis library for Python. It provides fast, flexible, and expressive data structures designed to make working with structured (tabular, multidimensional, potentially heterogeneous) and time series data easy and intuitive. At OrcaMinds, our individual Pandas training program takes you from beginner to expert in data analysis with hands-on projects, real-world datasets, and expert mentorship.
We offer flexible scheduling, one-on-one attention, and practical coding exercises. Whether you are a data science aspirant, business analyst, researcher, or software developer, our Pandas course will help you master data cleaning, transformation, aggregation, merging, and visualization.
Course Curriculum
Module 1: Introduction to Pandas
What is Pandas? Installing Pandas, Series (1D labeled array), DataFrame (2D labeled data structure), reading data from CSV/Excel/JSON.
Module 2: Data Inspection & Exploration
Viewing data (head, tail, sample), info(), describe(), shape, dtypes, understanding data structure and statistics.
Module 3: Data Selection & Filtering
Selecting columns, filtering rows with conditions, loc[] and iloc[], boolean indexing, query() method.
Module 4: Data Cleaning
Handling missing values (isnull, dropna, fillna), removing duplicates, handling outliers, data type conversion.
Module 5: Data Transformation
Creating new columns, apply() and map() functions, lambda functions, string operations, datetime handling.
Module 6: Grouping & Aggregation
groupby() operations, aggregate functions (sum, mean, count, min, max), pivot tables, crosstab.
Module 7: Merging & Joining
concat(), merge(), join() - combining multiple DataFrames, handling different join types (inner, outer, left, right).
Module 8: Time Series Analysis
Working with dates and times, date ranges, resampling, shifting, rolling windows, time zone handling.
Module 9: Data Visualization with Pandas
Basic plotting with Pandas (line, bar, histogram, scatter, box plots), integration with Matplotlib and Seaborn.
Module 10: Performance & Best Practices
Vectorized operations vs loops, memory optimization, working with large datasets, efficient coding practices.
Course Features
1-on-1 Training
Real Datasets
Flexible Schedule
Industry Projects
Certificate Included
Placement Support
Your Learning Journey
Assessment & Goal Setting
We assess your current Python knowledge and define your learning goals and timeline.
Interactive Learning Sessions
Weekly one-on-one sessions covering theory, practical coding, and problem-solving.
Hands-on Projects
Real-world data analysis projects using authentic datasets from various domains.
Assessment & Certification
Final project submission, assessment, and course completion certificate.
Projects You'll Build
Sales Data Analysis
Analyze sales trends, top products, seasonal patterns
Customer Segmentation
Group customers based on purchasing behavior
Employee Attrition Analysis
Analyze factors affecting employee turnover
Financial Data Analysis
Stock price analysis, returns calculation, trends